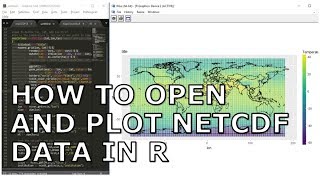
Open, Read and Plot NetCDF GCM Data using R Studio.

ฝัง
- เผยแพร่เมื่อ 15 ต.ค. 2024
- Email: Haroonhaider32@gmail.com
Whatsapp: +923027501600
R-Codes: docs.google.co...
netcdf in r
netcdf in rust
netcdf read in matlab
netcdf in r raster
netcdf read in r
read netcdf in r
raster netcdf in r
netcdf in r tutorial
using r with netcdf
open nc files in r
merge nc files in r
nc files raster
raster nc file r
read a .nc file in r
create nc file in r
how to read nc files in r
how to open .nc files in r
load nc file in r
plot nc file in r
read nc files in r


i'm addicted on ur two wrd coma-coma
Is it possible to plot netcdf for selected area.. Suppose for a country or water basin
Bro very well explained but I would like to ask you one question kindly answer if you can.
as you can see from the following equation
here four values are constant and one value is a variable which is NC file. So my question is how can calculate by R software? I hope you can answer this one as you are a good expert in this field. thank you
Constant values
a=3.1
b=2.1
c=3.1
d=4.1
variable file
infile.nc
a(ln(1-(1-exp(- infile.nc/c)^d)))b
Hello, thanks for the tutorial. I have a problem: Error in UseMethod("mutate") : no applicable method for 'mutate' applied to an object of class "c('array', 'double', 'numeric')", how I could solve this?. Thank you so much ¡¡
Thank you so much fo the video. U have shown that for monthly data we use >tem.slice
You have used temperature data. Now, if we are going to use rainfall data will there be in changes in the code.
sim haverá mudança no código. a mudança seria em tmp.array
Aula muito boa parabéns ☺️☺️☺️
Thank you, this video has helped me too much 👍👍
you are welcome...
SIr could you please tell hwo to set color levels while plotting a spatial plot in R. Can i get a better plot like in python and all in R
Hi sir,
Can you please plot vorticity of zonal and meridonal winds at different pressure levels?