Tecan's Magellan Microplate Reader Software - Creating a Method with Standard Curve Analysis

ฝัง
- เผยแพร่เมื่อ 12 ก.ย. 2024
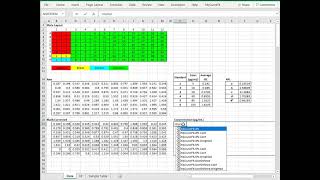
- This video describes how to create a simple method file in Tecan's Magellan software that will measure samples and derive concentrations for the samples using a standard curve. The method created here is relevant for use in ELISA assays, Protein & Nucleic Acid quantitation, or other assays where a standard curve is used. This video content does not contain instructions on how to optimize the measurement settings of your microplate reader.
Please return to this channel in the future or subscribe in order to be notified when new content is added. Links to more advanced Magellan concepts and tips for optimizing settings for Absorbance, Fluorescence, and Luminescence detection will be added soon.
The information provided in this video is not a substitute for official training from the manufacturer.
Magellan - How to run a method, collect and analyze data with a standard curve • Tecan's Magellan Micro...


how can we set up two plates--one is for standard curve and another one is for sample plate?
sorry for not replying sooner as I do not monitor this channel often. For anyone reading the comment who is interested, the software lets you choose how many plates a method will measure. As you begin to enter measurement parameters in Magellan there will be a selection in the lower left of the window to indicate how many plates it should expect. Keep in mind that as you add plates, the software will require that you define the layout for each plate. When creating the layout for the first plate, put your standards on that plate and any other samples or controls that will occupy the plate too. There will be an option along the top of the plate layout window to advance to what the layout will be for the second, third plate etc and you'll want to filly those layouts with the appropriate identifiers. When the method is eventually executed, the software will read the first plate and then prompt the user to insert the next plate, and so on. If the method calls for more plates than you plan to read, that is OK. You will just stop the process of reading once the last plate is measured. The software will then do the analysis on the plates that were measure.
Thanks for the information its really helpful
I have a question suppose i have generated a kinetic read of 90 mins data wd basic protocol now i want it to export it in a column format( like all A1 wells time points together) not in a plate map manner Can we do it...? Or before read only we have to do setup?
I tried but its always gets exported to excel in plate format😊
Sorry for the very delayed response. When editing your method, navigate to the screen where you can edit settings such as Data handling and select “data export”. In the data export window select the “export options” button and pick the export option “result” called Table(data in rows). This will export information for each well across the spreadsheet in rows so that each column will contain a specific type of data you are exporting such as, raw, mean, concentration, etc.
Hi I apologize for never replying to you. I should have turned off comments because I am not monitoring these videos for questions. Either way, here is an answer to anyone else who has a similar question.
As you are creating a method or reviewing data that has been collected, there are settings under "Data Export" where the format of the exported data can be driven into matrix, column, or row formats. You will find these in Data Export, "Export Options" visible in the video starting @10:26. To have your data appear with the wells running down the left side of the spreadsheet and columns of data types running across the top, select "Table(well data in rows). Thx
ChroMate 4300
PC controlled ELISA microplate reader
Measures Absorbance of 96 wells in approximately 12 seconds
User-friendly intuitive software
Automatically positions plate, blanks, reads and calculates results
Uses standard microwell plates for all reactions
open system
Four filter model (405 nm - 630 nm)
Optional 6 filter VIS model (405 nm - 630 nm)
I need a definition
ChroMate 4300
Hi! I am using a Tecan Sunrise microplate reader with the Magellan software for doing an standard curve but I have a problem. Whenever I want to run my curve, the machine says that I don't have enough base points... so, what I tried to do was a blank reduction (I am not sure if this was what I supposed to do but I gave it a chance) but I do not have the automatic option in the transformation section to do this. I tried to fix this by putting the formula (x-BL1) directly but it doesn't seem to be working. Can you help me with this please? Thanks!
please go ahead and email me your magellan method directly to rcavicke@roadrunner.com and I will take a look. Because this is not an official Tecan site, I have to take your inquiry to my personal email address. Thanks for understanding.
As long as you have defined at least two wells with the identifier called ST1_1 and ST1_2, and valid data points are collected for these wells, the software can plot a curve. Once you read the plate, if all of the data points for your standards are "OVER" , or if only one standard has a valid data value and the rest are "OVER", and beyond the OD range of the instrument, it will not be able to plot any points you'll get an error that there are not enough base points.
Thank you can i read without installing in PC
Only if your plate reader is a Sunrise with a touch screen.