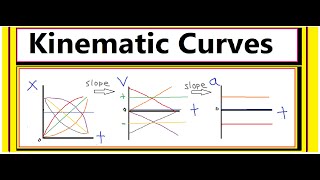
Hey, for the first graph , in which velocity is increasing in the negative direction, shouldn't your v-t time graph should be plotted like , a line below y-axis , in which starts from a random point at y-axis and going towards to x-axis(time t) with constant slope
Good question! The slopes on the x vs. t graph are becoming increasingly steeper in the negative direction. Therefore the velocity is becoming a larger and larger negative velocity, so the line on the v vs. graph would slope away from the x-axis to show that the value is becoming a greater negative velocity. I hope that helps!
@@beatphysics Thanks for the reply, I really appreciate that, actually my physics teacher did exactly what I asked in the question, and I got confused when I watched the video, but now it helps . Thanks, keep going on with the good work


that phrase "increasing in the negative velocity" really cleared it up for me thank you!
I'm glad that was helpful!
Hey, for the first graph , in which velocity is increasing in the negative direction, shouldn't your v-t time graph should be plotted like , a line below y-axis , in which starts from a random point at y-axis and going towards to x-axis(time t) with constant slope
Good question! The slopes on the x vs. t graph are becoming increasingly steeper in the negative direction. Therefore the velocity is becoming a larger and larger negative velocity, so the line on the v vs. graph would slope away from the x-axis to show that the value is becoming a greater negative velocity. I hope that helps!
@@beatphysics Thanks for the reply, I really appreciate that, actually my physics teacher did exactly what I asked in the question, and I got confused when I watched the video, but now it helps .
Thanks, keep going on with the good work
how do we know (in the first example) that velocity will be a straight line?
All lines on a velocity vs time graph are straight unless you have changing accelerations.
Good video.
Thanks!