This video has been incredibly helpful! I have to code 800 free responses to a survey and several of those responses include multiple themes. I have no experience doing any kind of analysis and this has been a life saver!!! This video is succinct but detailed enough to demonstrate the topic adequately. You are an excellent instructor!
Thanks in a million. Great content. Awesome. Very well explained. I couldn't find this explanation--simply put anywhere else. Great teachers are hard to find. Grade: A++💥
Jacqueline, you're the best. Too many thanks. What about if the data is collected from a focus group discussion where you don't count the number of respondents? How do you analyse such data in MS Excel?
Bahati, for focus groups, we're not usually trying to report on the number of responses because you're using a small sample. Here are some resources that may be helpful: www.sagepub.com/sites/default/files/upm-binaries/11007_Chapter_7.pdf. www.cambridge.org/core/services/aop-cambridge-core/content/view/E5A028A3DA12A038A7D49566F73416B8/S0029665104000874a.pdf/focus-group-interview-and-data-analysis.pdf
Thank you, it helps me a lot!!! Just one question- do you have some reference (article, authors, or which theory model) to cite while using this technique? Based on which theory is based this? (just to proper cite it). Thank you, thank you.
Alkimistish, I don't have a specific reference but this type of analysis is referred to as Descriptive Analysis. Searching for this term will help you to find a source that works best for you.
Hi! This is a very easy video to follow along and understand, but I had a question. Suppose I want to compare the responses according to the gender or maybe different age groups, how would I go about that? Thank you in advance 🔥👍
What if we want to break the data even further by geographical location? Let's say that an earlier multiple choice question in the survey was "what dorm are you living in"
The responses to the question "what dorm are you living in" would be entered in the Data tab. After coding the answers to the open-ended question, I would add this as a new column in the Data tab. Then I would use a pivot table to cross tabulate the responses from the two questions. I do not have a pivot table video but perhaps this one may be helpful th-cam.com/video/peNTp5fuKFg/w-d-xo.html
Why your number of entertainment divided by total is different like it's 3 but when you click it is showing 16 !!! And in my laptop, this formula of calculating frequency is not working it's showing error or #name.
What you're seeing in video is not the number 16. You're seeing i6 (I6). Because I used the "=", I am asking Excel to take the contents from i6 and use it for this new cell. The contents in i6 is "3" so when I hit "enter" Excel obeys the command and displays the contents of i6. I'm not sure why the formula is not working. Here is the Microsoft Office support page for this formula support.office.com/en-us/article/countif-function-e0de10c6-f885-4e71-abb4-1f464816df34
I have a question why did you numbered the responses to 1-15? You are analyzing number 6? Thank you for a great video. I am new in learning research and my professor ask us to analyze an open-ended question and I am a little confused.
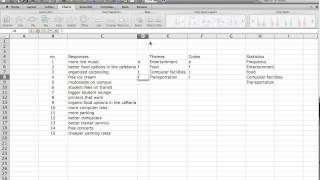
Nikka Rose, the first step in data analysis is writing a number on the completed questionnaires you have collected from respondents. In this demonstration, there were 15 completed questionnaires. When you enter the data in the spreadsheet, you enter the number of the questionnaire and then you enter the answer to Question 6 from that questionnaire. We do this so that if there is an error with the data entry or if we want to check that the data entry is accurate, we can compare the spreadsheet with the actual questionnaires.
Thank you for replying. I am a student and a beginner in learning research. Our professor ask us to construct a survey and interpret it. I am searching for references to help me in analyzing my data and I happened to stumbled upon your video. It is very informative. Thanks a lot Ma'am!
Hello. Thank You for your video. It is really helpful. Can you kindly tell me what is the name of this kind of analysis? Can this be called content analysis? I have a paper submission due next week. I want to follow this method of analysis but, need an exact name of this process to mention in the analysis part that what kind of analysis I did. I'd really appreciate an answer. Thanks in Advance.
Hello Jacqueline, Could you please tell me which version of Excel did use for the analysis. I use Excel 2007, and when it comes to do the frequency operation using the "COUNTIF" function, Excel opens an error message.
Lilian, I think COUNTIF is available in all versions of Excel, I just tried it in the online version and it worked. Here's a resource that may be helpful support.office.com/en-us/article/COUNTIF-function-e0de10c6-f885-4e71-abb4-1f464816df34
Hi again, I fixed the problem thanks to you Jacqueline. The link you sent me was very helpful, and I watched again your tutorial, which helped me have a better idea about the issue. Thank you sooooooooooooo much for your time and for your help. God bless you ^_^


This video has been incredibly helpful! I have to code 800 free responses to a survey and several of those responses include multiple themes. I have no experience doing any kind of analysis and this has been a life saver!!! This video is succinct but detailed enough to demonstrate the topic adequately. You are an excellent instructor!
Thank you Carolyn. I'm really glad it was so helpful! Hope all goes well with your research
I just found your part 1 of this series last week and part 2 came just in time...thank you!
Thank you so much, this was so very helpful for an assignment on qualitative analysis that had not been sufficiently explained!
This and part 1 were very helpful by the way; so so appreciated!!!
Since i do not know how to do coding and analysis for my research findings I left my research untouched until got your video. thanks very much
Very interesting knowledge, thank you
excellent this was exactly I was looking for analyzing the open-end questions. Thank You very much
Glad it was helpful!
Great video. Simple and precise explanations. Thank you 😊
Thanks in a million. Great content. Awesome. Very well explained. I couldn't find this explanation--simply put anywhere else. Great teachers are hard to find. Grade: A++💥
Glad it was helpful!
Great! It's very helpful! Thank you
Glad it was helpful!
Thank you that was of a big help!
You're welcome! Glad it was useful
Awesome video, thanks!
really proved to be useful thanks for the video
Thank you!!
Jacqueline, you're the best. Too many thanks. What about if the data is collected from a focus group discussion where you don't count the number of respondents? How do you analyse such data in MS Excel?
Bahati, for focus groups, we're not usually trying to report on the number of responses because you're using a small sample. Here are some resources that may be helpful: www.sagepub.com/sites/default/files/upm-binaries/11007_Chapter_7.pdf. www.cambridge.org/core/services/aop-cambridge-core/content/view/E5A028A3DA12A038A7D49566F73416B8/S0029665104000874a.pdf/focus-group-interview-and-data-analysis.pdf
@@jacquelineclarke received with thanks
this helps me a lot
Thank you, it helps me a lot!!! Just one question- do you have some reference (article, authors, or which theory model) to cite while using this technique? Based on which theory is based this? (just to proper cite it).
Thank you, thank you.
Alkimistish, I don't have a specific reference but this type of analysis is referred to as Descriptive Analysis. Searching for this term will help you to find a source that works best for you.
Thank you for yours replay. :)
Thank you so much , it was ver helpful
Hi. How do calculate Mean and Standard Deviation using this same example?
For standard deviation you can use this formula support.microsoft.com/en-au/office/stdev-function-51fecaaa-231e-4bbb-9230-33650a72c9b0
For Mean you can use this formula support.microsoft.com/en-gb/office/average-function-047bac88-d466-426c-a32b-8f33eb960cf6
Hi! This is a very easy video to follow along and understand, but I had a question.
Suppose I want to compare the responses according to the gender or maybe different age groups, how would I go about that?
Thank you in advance 🔥👍
Hi, you could use a pivot table in Excel to do this. Sorry, I don't have a video for pivot tables but there are lots available on TH-cam
@@jacquelineclarke Thank you for responding Jacqueline 👍
Is it relevant to include my spreadsheet in my thesis?
I would ask your adviser. They should have a better idea of what's expected/the norm for your department
What is the purpose of adddingg dollar signs to the cell?
Here is a tutorial that I think will answer your query. www.ablebits.com/office-addins-blog/2015/11/25/relative-absolute-reference-excel/
What if we want to break the data even further by geographical location? Let's say that an earlier multiple choice question in the survey was "what dorm are you living in"
The responses to the question "what dorm are you living in" would be entered in the Data tab. After coding the answers to the open-ended question, I would add this as a new column in the Data tab. Then I would use a pivot table to cross tabulate the responses from the two questions. I do not have a pivot table video but perhaps this one may be helpful th-cam.com/video/peNTp5fuKFg/w-d-xo.html
Why your number of entertainment divided by total is different like it's 3 but when you click it is showing 16 !!! And in my laptop, this formula of calculating frequency is not working it's showing error or #name.
What you're seeing in video is not the number 16. You're seeing i6 (I6). Because I used the "=", I am asking Excel to take the contents from i6 and use it for this new cell. The contents in i6 is "3" so when I hit "enter" Excel obeys the command and displays the contents of i6.
I'm not sure why the formula is not working. Here is the Microsoft Office support page for this formula support.office.com/en-us/article/countif-function-e0de10c6-f885-4e71-abb4-1f464816df34
@@jacquelineclarke hey thanks your video is very helpful
I have a question why did you numbered the responses to 1-15? You are analyzing number 6? Thank you for a great video. I am new in learning research and my professor ask us to analyze an open-ended question and I am a little confused.
Nikka Rose, the first step in data analysis is writing a number on the completed questionnaires you have collected from respondents. In this demonstration, there were 15 completed questionnaires. When you enter the data in the spreadsheet, you enter the number of the questionnaire and then you enter the answer to Question 6 from that questionnaire. We do this so that if there is an error with the data entry or if we want to check that the data entry is accurate, we can compare the spreadsheet with the actual questionnaires.
Thank you for replying. I am a student and a beginner in learning research. Our professor ask us to construct a survey and interpret it. I am searching for references to help me in analyzing my data and I happened to stumbled upon your video. It is very informative. Thanks a lot Ma'am!
I'm glad you found it helpful. Part 1 of the video is available here th-cam.com/video/yWBXV651yd4/w-d-xo.html
Hello. Thank You for your video. It is really helpful. Can you kindly tell me what is the name of this kind of analysis? Can this be called content analysis? I have a paper submission due next week. I want to follow this method of analysis but, need an exact name of this process to mention in the analysis part that what kind of analysis I did. I'd really appreciate an answer. Thanks in Advance.
This type of analysis is referred to as descriptive analysis. You can find more information here: www.socialresearchmethods.net/kb/statdesc.htm
Thank You so much for your reply. I really appreciate it. Thanks a lot.
Hello Jacqueline,
Could you please tell me which version of Excel did use for the analysis. I use Excel 2007, and when it comes to do the frequency operation using the "COUNTIF" function, Excel opens an error message.
Lilian, I think COUNTIF is available in all versions of Excel, I just tried it in the online version and it worked. Here's a resource that may be helpful support.office.com/en-us/article/COUNTIF-function-e0de10c6-f885-4e71-abb4-1f464816df34
Hi again,
I fixed the problem thanks to you Jacqueline. The link you
sent me was very helpful, and I watched again your tutorial, which
helped me have a better idea about the issue.
Thank you sooooooooooooo much for your time and for your help. God bless you ^_^
thank you
hi..if the respondents leave it blank or just write 'none'/'no comment', do we need to add another code for it?
No, you don't need to add a code for "none/no comment"
🙏
You're welcome!