Skip the waitlist and invest in blue-chip art for the very first time by signing up for Masterworks: masterworks.art/kenji Purchase shares in great masterpieces from artists like Pablo Picasso, Banksy, Andy Warhol, and more. See important Masterworks disclosures:
Im a junior in high school right now, and i have to do a stem project. i chose to build an algorithm to pull real world data and implement it into an excel sheet. just as i was thinking "how am i possibly gonna do this, there's no way there's just a video titled stock portfolio tracker on excel using real time data", i found this video. i actually started laughing out loud because this video is literally all i needed! thank you bro
Extremely useful video. Been meaning to do something like this for 5 years, I broke down individual accounts and then made a "Mega" dashboard with everything on it, I also split up my CAD/USD trades with currency exchange. I really appreciate the solid baseline that your video created and taught me how to use a lot of very useful excel functions. Thanks!
Firstly, start working with a professional investment manager if you have any, if you don't, I'Il recommend Expert Williams T. Kevin , He's really one of the best manager I'd trade with, he's going to guide you and give you the rundown on how to get started on a profitable investment journey.
It's. fascinating to see someone that employ Williams T. Kevin investing services. he has been helping lot's of [people recover their losses from the crash, he's all we need right now. Investing has so much advantages as it is volatile, this is a perfect time to partake in it.
I am mindblown with the combination of features you used in this video. I will definitely use this in my spreadsheets! I am having some trouble though when putting different kinds of bonds into the mix (stocks + obligations + etfs). Do you have a video on how to make an overview for this? Keep grinding!!
No one, NO ONE, can argue Aaron strategy at least currently, the best out there, even when Bitcoin is looking bearish with the market sentiment swinging low. But they kept us grounded with their real analysis, just the facts in the charts.😎
You guys figure out how to get stock type data to work in Excel without investing in 360? I'm logged in to my account. I can get the plug in that displays a stock price to work. Stock type data, however, just doesn't show up on the ribbon.
In the formula it gave me an empty array error. I don't understand the formula that you are using since you asking excel to see the stock names greater than zero not a number, so of course it gives me an empty array error because there are no names that can be bigger than zero, it is a stock name not a number. Can you explain this
There is a slight error with the way excel has updated formula input. Try the following formula: =UNIQUE(FILTER(Table_1[Company],SUMIF(Table_1[Company],Table_1[Company],Table_1[Units])>0))
This is great how ever id like to add an “initial investment” column, calculated by multiplying the cost of the transaction by # of shares, but cannot for the life of me work out the formula. I have a similar transactions sheet. Any help?
I sure hope I have not missed the answer to my question and thus wasted your space in this excellent set of comments. As an income investor, I am most interested in the total return of a security, meaning its unrealized capital gain and income earned during a relevant period. Namely, what was the return on my investment taking unrealized capital gains and realized income payments (interest on bonds, interest on GICs, etc..)? How would you go about building a page for this? Thanks so much for any help you can give me.
How can I incorporate dividends being reinvested into this sheet? My total gain is off because of fractions of shares being purchased over time! Thanks!
Fantastic work, thx a mil ! How do we set up the minimum of the chart to be dynamic according to the stock price? If the stock ranged into 100 to 110 for 6months let's say, the chart will start at $0 ...
How would you account for stocks that are traded within different markets that are in £,$, Euros, and even UK pence. Is there a way to automate this? I ahve had problems
What about Realised (P/L)? What would happen to shares which are sold out (Buy Quantity = Sell Quantity). This portfolio doesn’t cover it. Thanks Kenji
I downloaded the file to create the portfolio tracker in excel and found on the transaction screen that the Icon for the share information for the stock was not there. Therefore when I loaded the stock tracker add-on, I still was not able to get the information about the stock. Would you please send me the file with the Icon column already in place. Thank you
Another great video Kenji, really enjoy your content. Was hoping to use your model as a basis for my own portfolio analysis tool, but want to include dividends and cash balance and some other analysis/statistics. However, it would be great to include a historic chart of the portfolio balance per day, just as a STOCKHISTORY but for the current portfolio instead of a particular stock. Any tips on how to approach that? Don't want to manually save the end-of-day balance, struggle to find a dynamic solution for this... Thanks
Yes! I loved the video and adapt for my portfolido but I found the same point with you, plus if you trade short term there's no tool to track/record the gain/loss actually realized after selling a part of all of a particular stock among the portfolio.
great video.. was looking for this, to pull the data from the transaction table to the dashboard using unique and filter. probably need to sort out in alphabetical order (I guess need to do it myself :-) ). actually want to know how to sort company name, market values, allocations, etc.
Any idea on how to create a real time Technical Scanner signaling a special indicator/s event? like MV Cross over or MACD Histogram , etc ROC crossed above/below Zero. etc.?
In the Charting tab, when I use stockhistory for ETH/EUR for example, the list of prices is in USD. Is this a formatting issue only or is it not retrieving the right trailing prices? Similarly, in Charting, if I want to compare Apple's prices in EUR with other stocks from my Portfolio, how can I retrieve the prices in EUR and not USD? Once again the prices come up in USD with stockhistory, even when I select Apple from other European stock markets.
Hey Kenji!! Really love your video...however there's a slight problem...the stocks data type is available for Office 365 users and I'm a student not having Office 365...can you tell me how to proceed or any feasible solution?
Muchas gracias por compartir conocimiento valioso! una pregunta, en el gráfico comparativo las líneas no terminan en los precios exactos, por ejemplo GOOG vs AMZN: AMZN CERRO HOY 10/05/22 $2,177, sin embargo en el gráfico el último punto de la línea se ubica por debajo de $2,000.... Se puede mejorar la precisión o es solo para ver la tendencia? Gracias!
Great video! Could you (or someone else) explain how I can add purchase price per share, based on the transactions? I find it hard to find the avarage purchase price, when there's different purchase prices. I found one way, but the complication is in a scenario where I have bought, sold and then bought again. Then the first purchase is included in the calculation, which messes up the avarage purchase price inmy current holding. Thanks :)
hi how do i get this fund HSBC FTSE 100 Index Income C into my stock portfolio in excel please because every time i try it changes to HSBC HOLDINGS PLC (XNYS:HSBC) i have same problem with other funds to.. i am just trying to build portfolio of dividend's and funds. i live in uk and have Microsoft 365 kind regards kev
I must have missed the part about how to use live data - I guess I'm confused as to where you are pulling your data from and how things are auto populating... The excel download just seems to be a blank sheet.
Hey hard to say but it might have to do with how your excel cell is formatted. For example if you have USD format, even if the number is in JPY, you'd still have the USD sign.
Its not working for me, i was always working in Excel or Sheets Online with Google. May it be because of it ? When in transaction i wanna writte " Apple" it doesnt fill out anything .
Hey Kenji! Is there a way to set up projected returns in this file? i.e.) if you want to invest in either Apple or Amazon and play with hypothetical projections. Is there a way to see which one will return the most based on capital allocation/how many shares you invest? Let me know if this made sense
most people remain poor only because friends and relatives discouraged and advised them against investing and trading forex while the wise ones kept investing and going higher financially


Skip the waitlist and invest in blue-chip art for the very first time by signing up for Masterworks: masterworks.art/kenji
Purchase shares in great masterpieces from artists like Pablo Picasso, Banksy, Andy Warhol, and more.
See important Masterworks disclosures:
Hey Kenji are u from Spain or where are u from???
Im a junior in high school right now, and i have to do a stem project. i chose to build an algorithm to pull real world data and implement it into an excel sheet. just as i was thinking "how am i possibly gonna do this, there's no way there's just a video titled stock portfolio tracker on excel using real time data", i found this video. i actually started laughing out loud because this video is literally all i needed! thank you bro
Extremely useful video. Been meaning to do something like this for 5 years, I broke down individual accounts and then made a "Mega" dashboard with everything on it, I also split up my CAD/USD trades with currency exchange. I really appreciate the solid baseline that your video created and taught me how to use a lot of very useful excel functions. Thanks!
Successful people don't become that way overnight, What most people see at a glance wealth, a great career and purpose is the result of hard work.
Firstly, start working with a professional investment manager if you have any, if you don't, I'Il recommend Expert Williams T. Kevin , He's really one of the best manager I'd trade with, he's going to guide you and give you the rundown on how to get started on a profitable investment journey.
It's. fascinating to see someone that employ Williams T. Kevin investing services. he has been helping lot's of [people recover their losses from the crash, he's all we need right now. Investing has so much advantages as it is volatile, this is a perfect time to partake in it.
this is EPIC!!!!!!! i am new to excel and i cannot reiterate how helpful this video was. thank you!
I am mindblown with the combination of features you used in this video. I will definitely use this in my spreadsheets! I am having some trouble though when putting different kinds of bonds into the mix (stocks + obligations + etfs). Do you have a video on how to make an overview for this?
Keep grinding!!
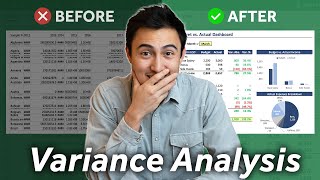
Great work Kenji and even sold items also showing in Dashboard
Absolute legend. Exactly what I needed
Is there a way to also have this track Cash when selling stocks, Dividends being reinvested, etc?
Great video. How would I add a split in this document or track dividends?
I’ve noticed a flaw in the excel if you bought 10 shares of a stock and sold 5 the excel doesn’t know what you’re purchased price is there a fix?
Nice work Kenji 👍👍👍👍
It
his Te-le-gr am @A_aaron7
No one, NO ONE, can argue Aaron strategy at least currently, the best out there, even when Bitcoin is looking bearish with the market sentiment swinging low. But they kept us grounded with their real analysis, just the facts in the charts.😎
Aaron's strategy has helped a lot of traders & newbies out there, and with their program one can recover losses from crash so quickly.
The economic hardship, recession, unemployment and the loss of job caused by covid pandemic is enough to push people into financial ventures.
Great video Kenji. really enjoy it.
Very nice portfolio! I'm copying this on Google Sheets! Thanks!!!
Hi.. great videoes👍
hi Kenji, why do you do a Day Change column for? How is it useful?
how to add industry in google sheets?
This was a brilliant video and spreadsheet ! Wonderful work. I wish you had shown how we can show a list of booked profits as well in this sheet.
This is a good video but the excel download that goes with this video doesn't have the company and ticker names in the transactions tab.
Yes please address this issue Kenji.
You guys figure out how to get stock type data to work in Excel without investing in 360? I'm logged in to my account. I can get the plug in that displays a stock price to work. Stock type data, however, just doesn't show up on the ribbon.
Awesome vid and channel, vids are so informative on financial topics
Legit excel skillz
Thank you Salvador Dali 🧐
Love your videos
Excellent Kenji! 😄
Thank you!
I can't see "Data type" in my Excel 2021 LTSC . Do this feature available in excel 365?
You must install english language pack for the data tab to become visible (file>option>language)
i think this is only a 365 feature. i have 2021 too and see now data types
Thank you Kenji
Thank you Kenji! 🐐
Haha thanks Dante!
Do you have a video on bonds portfolio need help asap
stockhistory is a new one for me...cool one thanks
Cheers!
In the formula it gave me an empty array error. I don't understand the formula that you are using since you asking excel to see the stock names greater than zero not a number, so of course it gives me an empty array error because there are no names that can be bigger than zero, it is a stock name not a number. Can you explain this
There is a slight error with the way excel has updated formula input. Try the following formula: =UNIQUE(FILTER(Table_1[Company],SUMIF(Table_1[Company],Table_1[Company],Table_1[Units])>0))
Well explained! Thanks for the vid and the template...!
No problem!
This is great how ever id like to add an “initial investment” column, calculated by multiplying the cost of the transaction by # of shares, but cannot for the life of me work out the formula. I have a similar transactions sheet. Any help?
I sure hope I have not missed the answer to my question and thus wasted your space in this excellent set of comments. As an income investor, I am most interested in the total return of a security, meaning its unrealized capital gain and income earned during a relevant period. Namely, what was the return on my investment taking unrealized capital gains and realized income payments (interest on bonds, interest on GICs, etc..)? How would you go about building a page for this? Thanks so much for any help you can give me.
What will happen when a stock splits or reverse splits? Will it update or do I have to manually work that out?
Hi Kenji. This excel file isn't letting me insert recommended charts such as the pie chart. Any solutions?
How can I incorporate dividends being reinvested into this sheet? My total gain is off because of fractions of shares being purchased over time! Thanks!
what excel version do you use
Fantastic work, thx a mil ! How do we set up the minimum of the chart to be dynamic according to the stock price?
If the stock ranged into 100 to 110 for 6months let's say, the chart will start at $0 ...
HI Kenji, if want to add the cost/share based on all the buy and sell done per stock category. How do we add that to this excel?
How would you account for stocks that are traded within different markets that are in £,$, Euros, and even UK pence. Is there a way to automate this? I ahve had problems
What about Realised (P/L)?
What would happen to shares which are sold out (Buy Quantity = Sell Quantity).
This portfolio doesn’t cover it.
Thanks Kenji
CAN YOU SHARE A VIDEO FOR A TRADING JOURNAL WITH MULTIPLE SCRIPS BOUGHT AND SOLD AT DIFFERNT TIMES ALONG WITH FIFO PROFIT/LOSS
can you explain or make a video about how to include the cash position in such a portfolio (typically the portfolio breakdown)
Can this be used with Google Sheets?
just wonder how you can do for crypto dashboard?
Hi when adding new stock on the transaction tab it doesn't automatically update on the dashboard. Please can ou help me with this. Thanks
Think these features are only available in Microsoft 365?
Is it possible to add liquidity? USD or EUR I have in the allocation
good content, thanks
Very useful but needs ability to include realized gains to be able to work TRR etc
Unique function doesn't works for my excel.. What should I do?
Excellent video
Thank you very much!
I downloaded the file to create the portfolio tracker in excel and found on the transaction screen that the Icon for the share information for the stock was not there. Therefore when I loaded the stock tracker add-on, I still was not able to get the information about the stock. Would you please send me the file with the Icon column already in place. Thank you
Hey some versions of microsoft excel don’t have access to stock price data. Are you using micrsoft 365? If not you might not have access unfortunately
Another great video Kenji, really enjoy your content. Was hoping to use your model as a basis for my own portfolio analysis tool, but want to include dividends and cash balance and some other analysis/statistics. However, it would be great to include a historic chart of the portfolio balance per day, just as a STOCKHISTORY but for the current portfolio instead of a particular stock. Any tips on how to approach that? Don't want to manually save the end-of-day balance, struggle to find a dynamic solution for this... Thanks
Yeh much required
Yes! I loved the video and adapt for my portfolido but I found the same point with you, plus if you trade short term there's no tool to track/record the gain/loss actually realized after selling a part of all of a particular stock among the portfolio.
Any updates from here? lol. i"m also looking for that function.
Can you please teach us tableau from beginning.
wow I want to invest in art!!
nice! check the link in the description :)
great video.. was looking for this, to pull the data from the transaction table to the dashboard using unique and filter.
probably need to sort out in alphabetical order (I guess need to do it myself :-) ). actually want to know how to sort company name, market values, allocations, etc.
how to download stock data with a Mac?
Any idea on how to create a real time Technical Scanner signaling a special indicator/s event? like MV Cross over or MACD Histogram , etc ROC crossed above/below Zero. etc.?
how do I find SPY ETF?
In the Charting tab, when I use stockhistory for ETH/EUR for example, the list of prices is in USD. Is this a formatting issue only or is it not retrieving the right trailing prices? Similarly, in Charting, if I want to compare Apple's prices in EUR with other stocks from my Portfolio, how can I retrieve the prices in EUR and not USD? Once again the prices come up in USD with stockhistory, even when I select Apple from other European stock markets.
Hi. How does the prices get updated when you open the file next day? It doesn't get updated for me. Thanks!
I saw it. Thanks! Great video! :)
Please make video on how to get data from bloomberg
Hey Kenji!!
Really love your video...however there's a slight problem...the stocks data type is available for Office 365 users and I'm a student not having Office 365...can you tell me how to proceed or any feasible solution?
In sensivity analysis I'm getting #Div/0! in two cells.whats the reason
Muchas gracias por compartir conocimiento valioso! una pregunta, en el gráfico comparativo las líneas no terminan en los precios exactos, por ejemplo GOOG vs AMZN: AMZN CERRO HOY 10/05/22 $2,177, sin embargo en el gráfico el último punto de la línea se ubica por debajo de $2,000.... Se puede mejorar la precisión o es solo para ver la tendencia? Gracias!
Flodesk did not send me the download after I submitted my email address. Flodesk not ready for prime time?
Check your browser downloads / computer downloads folder
Great video! Could you (or someone else) explain how I can add purchase price per share, based on the transactions? I find it hard to find the avarage purchase price, when there's different purchase prices. I found one way, but the complication is in a scenario where I have bought, sold and then bought again. Then the first purchase is included in the calculation, which messes up the avarage purchase price inmy current holding. Thanks :)
hi how do i get this fund HSBC FTSE 100 Index Income C into my stock portfolio in excel please because every time i try it changes to HSBC HOLDINGS PLC (XNYS:HSBC) i have same problem with other funds to..
i am just trying to build portfolio of dividend's and funds.
i live in uk and have Microsoft 365
kind regards
kev
I must have missed the part about how to use live data - I guess I'm confused as to where you are pulling your data from and how things are auto populating... The excel download just seems to be a blank sheet.
I get an error when I use #. =E5# - gives an error but If I don't use it it works but it does not auto populate the cells. Help?
May I ask which university you attended in Spain ?
I graduated from Cornell University actually (it’s in the US)
Thank you for your response! Didn’t you mention you attended a Spanish university before transferring to Cornell (in a other video) ?
Please make video that what Financial analyst do in regular job
Your content is an asset. Keep going in this way
I appreciate that! More to come hopefully :)
I click data , stocks, choose my " company".
It is show USD by default. can i change to other currency such as UK? SGD, JPY?
Thank you
Hey hard to say but it might have to do with how your excel cell is formatted. For example if you have USD format, even if the number is in JPY, you'd still have the USD sign.
Its not working for me, i was always working in Excel or Sheets Online with Google. May it be because of it ?
When in transaction i wanna writte " Apple" it doesnt fill out anything .
Love it. How do I make an excel chart that compares return of two stocks over a given time period?
Thanks dude
Hi thank you for your especial efforts
I was going to ask you to send me this excel file because I can't download it
Warmest regards
Hey Kenhi, did you major in Finance or Accounting in University?
Looks great but my ineptitude with Excel means the formula input does now work for me.
I need this. Thank you!
You're so welcome!
So helpful!! Thanks
Glad it helped!
I have a problem on the date history it smth inlcudes bank holidays, So I get NA can someone help?? THX
CTL + T is not working initially
hi can you alaso do crypto?
Did anyone receive the Excel Sheet template? I submitted my email and still haven't received anything
Please make valuation of Apple from scratch to end as the Financial analyst do
The video is a good one unfortunately the tracker is not working with fractions of shares
Thanks for your content this is better than taking an actual class.
haha thank you!
Excellent video ! Thank you so much and cannot wait to see further of your content !!
Thank you, more to come!
Could you do something similar for crypto coins?
Hey Kenji! Is there a way to set up projected returns in this file? i.e.) if you want to invest in either Apple or Amazon and play with hypothetical projections. Is there a way to see which one will return the most based on capital allocation/how many shares you invest?
Let me know if this made sense
The live stock data import is next level!
I know so cool!
too bad the download doesn't work correctly.
How so? You should get an email with the file
Gracias!
Gracias a ti por ver el video!
Hi how can I get a hold of you?
Email? Social?
did anyone get this to work?
didn't work, excel file has errors, #Value! no drop down, not stocks.
My life has totally changed since I started an investment of $ 6,000 and now earning over $ 57,000
most people remain poor only because friends and relatives discouraged and advised them against investing and trading forex while the wise ones kept investing and going higher financially
2:37 this did not work for me
oh it should be ; instead of ,