I'm in the closing stages of my PhD and needed to get my head around GSEA and clusterprofiler in a short period of time, and this video was EXACTLY what I needed. Thank you!
I have been trying to figure out this part of my analysis for so long and was struggling with where to even begin but this video was perfect! So easy to understand and straight to the point, you're amazing. Thank you!
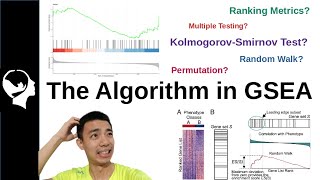
Thanks for the video! I think the table accompanying the hypergeometric testing is not accurate in a sense that the row and column names should be switched to match the definition though it is mathematically equivalent.
Thanks for these nice videos, your tutorials are a great resource! I was wondering, for the GSEA analysis, should you not filter out noise? Like genes that are not DEGs based on p value alone (not fold change)? Otherwise, your input will be full of genes that are just noise, but GSEA only takes into account the ranked list of logFC. If a gene has a high logFC but it is not reproducible in your samples, it won't have a low pvalue and would be filtered out as noise in a DEG analysis. But if you input just a ranked list of all genes without filtering for pvalues prior, you might end up with many genes which are just noise? Thanks in advance!
Hi thanks for liking the video! Yes, for GSEA analysis, I usually filter and use only the genes with significant pval from their differential expression analysis output. -Lind
Great vedio.But I would have to clear something suppose i analysed a data set by deseq2 and found DEG .So now i have to convert the DEG symbol to entrez id for functional analysis.So will i now download the file into .csv and then cut the gene symbol from the file and save into a new excel sheet and import the R studio for the entrez id?After getting the id i again download the file and pick the entrez id and paste it in the first download file and remove the symbol?After that import the file and generate that.That'll about you mean to say the lecture??Am I write?Another thing is that My gene symbol is about Homo sapiens but you should there mmusculus.So what will be the code for homosapiens??
@@johirislam8174 See how in defining the object "gene_id" attributes was listed with 3 things: ensembl_gen_id, external_gene_name, and entrezgene_id. The c(2,3) you are querying is columns two and three in gene_id. That is because of the comma in the square brackets means the selection is on columns and not rows, see: gene_id[ ,c(2,3)] I believe you will understand the x and y by looking at the documentation for function merge() in r. Hope this helps!
What if I don't have DEGs but instead I have co-expression modules. I have a gene list with associated GO terms, but I don't have any LFC or values. Is it still possible to use clusterProfiler?
is it possible to do a gene set enrichment analysis without doing a DEG? In my lab, we have just started doing NGS and we are still setting up our QCs. What we have in mind right now for one of our QC is to see if we can guess which sample (there are 4 samples) came from which tissues (heart, liver, kidney, diluent) by doing a gene set enrichment analysis to see if we can identify overexpressed genes which may only be expressed in specific tissues. Do you think it's feasible? Thank you.
Oh you need to perform DGE. Differential gene expression analysis will come out a list of genes that the expression is distinguished from other samples, then GSEA is to understand what are terms/pathways that enriched in the DEGs. Hope this helps - Lind
Is it possible to apply this approach to RT-qPCR analysis? Obtaining relative quantification values (Ct or cycle threshold) normalized by its endogenous controls? Or just RNA-Seq?
Yes, it is the downstream analysis to look for the enrichment of a set of gene-of-interest, as long as you supply the correct gene IDs and/or the ranking values (log2FC in my example), hope this helps :) - Lind
Hi, I wrote a question about the argument of gseGO used in the script, but I found it deleted... can you please answer me if the argument "padjMethod" is neccessary in the analysis or not? I found several papers skipped with the argument, on the other hand, they used BH correction I would appreciate it for your advice. Thanks
Hi it is a statistical way to perform the multiple test correction, BH is commonly applied , you may change to other method or use the default one as most people do :) Here’s for better understanding: www.rdocumentation.org/packages/stats/versions/3.5.0/topics/p.adjust
Hi, thank you very much for the video. I am really new to R studio, and this maybe a stupid question, but could you kindly expand a bit more on the GOplot (circle_dat and GOChord) please? For example, I have an RNA-seq data (species: rat) with EMSEMBL IDs and log2fold changes, and would like to generate a circular plot as you did in this video. Thank you!
Hi thanks for your comment! Too bad that I afraid may not have time to demo properly, but I found the GOplot creator, Wencke Walter, has a very nice tutorial about it wencke.github.io/ hope it is useful for you :)
I am stuck how to do same thing for non model organism such labeo rohita which is present on NCBI. It doesn't have any ensemble id or anything Please help
Hi Nitin, yes, you need to create the gene annotation reference list yourself, here's the tutorial by the author GuangChuang Yu guangchuangyu.github.io/2015/05/use-clusterprofiler-as-an-universal-enrichment-analysis-tool/ hope it helps. -Lind
Hi, Really an awesome presentation...thanks a lot...can you please make video on analysing somatic mutation data from exome data analysis...or else suggest some good tools for somatic mutation data analysis in form of network analysis
For GSEA, you can decide based on the aim for the experiment, but I believe the default ranking tries to place upregulated genes on the left and down regulated genes on the right. So you can observe the effects of both in the enrichment analysis. -Brandon


I'm in the closing stages of my PhD and needed to get my head around GSEA and clusterprofiler in a short period of time, and this video was EXACTLY what I needed. Thank you!
Glad that it helps! All the best to your PhD :)
@@LiquidBrain Hello Great, lecture Give me your wechat id
Great What is enrichment? and Enrichment score? What are samples? You mean RNA from different plants spp or same spp
What is difference between false discovery rate and type errors
I'm exactly the same haha, bless this vid
I have been trying to figure out this part of my analysis for so long and was struggling with where to even begin but this video was perfect! So easy to understand and straight to the point, you're amazing. Thank you!
Thumbs up to you guys, what a wonderful channel, looking forward to see more bioinformatic enthusiasts in Malaysia
very kind of you to explain this sort of material. it could easily take a book probably for some to get through it.
Very useful video! Your English pronunciation is lovely!
Thank you! This video is amazing and easy to follow
Wow I watched your WGCNA Tutorial a few weeks ago and how I have to analyse my results and jsut saw you also have a GO video. Thanks
Thank you very much for making this video
It was very clear and straight to the point
very helpful. Thanks for sharing the knowledge!
having subtitles would be nice
Thank you very much. I like your presentation and explanation.
I use R then Loupe browse.. but I don't know how to present my results over a year of work as an PhD student??
Thanks for the video! I think the table accompanying the hypergeometric testing is not accurate in a sense that the row and column names should be switched to match the definition though it is mathematically equivalent.
Thanks for these nice videos, your tutorials are a great resource!
I was wondering, for the GSEA analysis, should you not filter out noise? Like genes that are not DEGs based on p value alone (not fold change)? Otherwise, your input will be full of genes that are just noise, but GSEA only takes into account the ranked list of logFC. If a gene has a high logFC but it is not reproducible in your samples, it won't have a low pvalue and would be filtered out as noise in a DEG analysis. But if you input just a ranked list of all genes without filtering for pvalues prior, you might end up with many genes which are just noise?
Thanks in advance!
Hi thanks for liking the video! Yes, for GSEA analysis, I usually filter and use only the genes with significant pval from their differential expression analysis output. -Lind
thank you so much for your presentation
So informative and helpful thank you ☺️
Thanks for your valuable tutorials.
Great vedio.But I would have to clear something suppose i analysed a data set by deseq2 and found DEG .So now i have to convert the DEG symbol to entrez id for functional analysis.So will i now download the file into .csv and then cut the gene symbol from the file and save into a new excel sheet and import the R studio for the entrez id?After getting the id i again download the file and pick the entrez id and paste it in the first download file and remove the symbol?After that import the file and generate that.That'll about you mean to say the lecture??Am I write?Another thing is that My gene symbol is about Homo sapiens but you should there mmusculus.So what will be the code for homosapiens??
Hi Johir, for converting the gene symbol to entrez ID, you can do it in R using biomaRt package:
library(biomaRt)
gene_id
@@LiquidBrain i am not clear about your data code.and gene id means my selected gene id?Yourdata
@@johirislam8174 See how in defining the object "gene_id" attributes was listed with 3 things: ensembl_gen_id, external_gene_name, and entrezgene_id.
The c(2,3) you are querying is columns two and three in gene_id. That is because of the comma in the square brackets means the selection is on columns and not rows, see: gene_id[ ,c(2,3)]
I believe you will understand the x and y by looking at the documentation for function merge() in r.
Hope this helps!
What if I don't have DEGs but instead I have co-expression modules. I have a gene list with associated GO terms, but I don't have any LFC or values. Is it still possible to use clusterProfiler?
Yes, you can use enrichplot package for the visualization :)
is it possible to do a gene set enrichment analysis without doing a DEG? In my lab, we have just started doing NGS and we are still setting up our QCs. What we have in mind right now for one of our QC is to see if we can guess which sample (there are 4 samples) came from which tissues (heart, liver, kidney, diluent) by doing a gene set enrichment analysis to see if we can identify overexpressed genes which may only be expressed in specific tissues. Do you think it's feasible? Thank you.
Oh you need to perform DGE. Differential gene expression analysis will come out a list of genes that the expression is distinguished from other samples, then GSEA is to understand what are terms/pathways that enriched in the DEGs. Hope this helps - Lind
Is it possible to apply this approach to RT-qPCR analysis? Obtaining relative quantification values (Ct or cycle threshold) normalized by its endogenous controls? Or just RNA-Seq?
Yes, it is the downstream analysis to look for the enrichment of a set of gene-of-interest, as long as you supply the correct gene IDs and/or the ranking values (log2FC in my example), hope this helps :) - Lind
Hi, I wrote a question about the argument of gseGO used in the script, but I found it deleted...
can you please answer me if the argument "padjMethod" is neccessary in the analysis or not?
I found several papers skipped with the argument, on the other hand, they used BH correction
I would appreciate it for your advice. Thanks
Hi it is a statistical way to perform the multiple test correction, BH is commonly applied , you may change to other method or use the default one as most people do :)
Here’s for better understanding:
www.rdocumentation.org/packages/stats/versions/3.5.0/topics/p.adjust
before doing gse are you filtering for pvaladj from your list of differential expressed genes?
Yes, based on what I understood, we can filter with adjusted p value -Lind
Hi, thank you very much for the video. I am really new to R studio, and this maybe a stupid question, but could you kindly expand a bit more on the GOplot (circle_dat and GOChord) please? For example, I have an RNA-seq data (species: rat) with EMSEMBL IDs and log2fold changes, and would like to generate a circular plot as you did in this video. Thank you!
Hi thanks for your comment! Too bad that I afraid may not have time to demo properly, but I found the GOplot creator, Wencke Walter, has a very nice tutorial about it wencke.github.io/ hope it is useful for you :)
I am stuck how to do same thing for non model organism such labeo rohita which is present on NCBI.
It doesn't have any ensemble id or anything Please help
Hi Nitin, yes, you need to create the gene annotation reference list yourself, here's the tutorial by the author GuangChuang Yu guangchuangyu.github.io/2015/05/use-clusterprofiler-as-an-universal-enrichment-analysis-tool/
hope it helps. -Lind
great
Thank you genius, can you please make mitch analysis on R :)
Hi,
Really an awesome presentation...thanks a lot...can you please make video on analysing somatic mutation data from exome data analysis...or else suggest some good tools for somatic mutation data analysis in form of network analysis
Hi may I know more what kind of somatic mutation analysis do you refer to?
Thanks for the great video! When performing gsea: should I only use up- or downregulated genes or all genes?
Thanks a Lot! :)
For GSEA, you can decide based on the aim for the experiment, but I believe the default ranking tries to place upregulated genes on the left and down regulated genes on the right. So you can observe the effects of both in the enrichment analysis. -Brandon
@@LiquidBrain thank you so much! Really love this channel
Very helpful!
Glad it was helpful!
Perfect!
I dont understand...
Really hard to catch up with what she is saying.
What is enrichment? Definition
Hi what do you want to know about the enrichment? Perhaps Google is your good buddy?
Thanks!
difficult to understand whether you are speaking chinese or english
sadly your stepwise guidance was not as great here