
ฝัง
- เผยแพร่เมื่อ 14 พ.ค. 2024
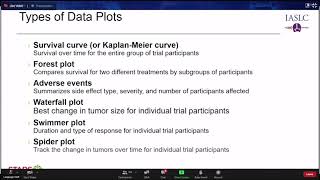
- Join a cancer scientist and research advocate as they discuss common charts, graphs, and terms used to describe clinical trial results and data at a level understandable by the general public. This webinar will help equip patients/survivors, caregivers, and research advocates with the skills to understand these data plots when they are shared with a journal article or quickly during a conference presentation.


Great explanation to typical graphs used for describing the clinical outcomes from different perspectives. Thank you very much.
Nice explanation. tku