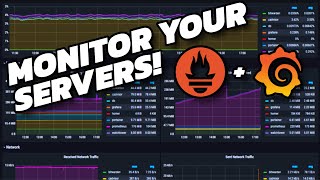
Monitoring Microservice using Prometheus and Grafana - Part 1 | Setup Grafana Dashboard
ฝัง
- เผยแพร่เมื่อ 16 ก.ค. 2024
- In this session, you will learn How to monitor microservice using Prometheus and how to create a dashboard in Grafana to visualize these metrics. I have also demonstrated how to create custom metrics.
Following concept you will learn in this video:
1. Prometheus architecture
2. Types of Metrics
3. Creating custom metrics in Spring Boot Microservice
4. Setup of Prometheus and Grafana
5. Creating dashboard in Grafana
Github repository: github.com/kodedge-swapneel/m...
Chapters:
0:00 Introduction
1:02 Prometheus Architecture
3:39 Types of Metrics
9:40 Hands-On
Monitoring Kubernetes and Spring Boot service using Prometheus and Grafana - Part 2 : • Monitoring Kubernetes ...
Alerting using Prometheus and Grafana - Part 3 : • How to configure Prome...
--------------------------------------------------------------------------------------------
Deploy Spring Boot App with MySQL on Kubernetes: • Deploy Spring Boot App...
To know more about Kubernetes services watch this video : • Deploy Spring Boot App...
AWS Application Load Balancer setup with target group EC2 : • AWS Application Load B...
AWS CodePipeline : • AWS CodePipeline with ...
AWS Lambda Hand-On Playlist : • AWS Lambda
AWS CloudFormation : • AWS CloudFormation
Subscribe on : / @kodedge
If you like the video please subscribe and comment.
Tags:
Prometheus
Grafana
Spring Boot Microservice
----------------------------------
Disclaimer/Policy:
- Video is intended for educational purposes only and explanations about technical topics.
- We make every effort to ensure the accuracy of the information presented, but we cannot guarantee that all information is current or entirely free from errors.
- Viewers are encouraged to exercise their own judgment and consider their unique circumstances when applying the information from this video.
- Mention of specific products, services, or brands in this video does not constitute an endorsement unless otherwise specified.
- By accessing and using the information presented in this video, viewers agree to do so at their own risk, and we shall not be liable for any damages or losses.
- All logos and images used in this video are the property of their respective copyright holders. Any copyrighted material is used here for educational purposes only.
- Our use of logos and images is not intended to challenge or infringe upon the rights of the copyright holders, and we acknowledge their ownership
- The inclusion of logos and images is for non-commercial, educational purposes only.
#prometheus #grafana #monitoring #kodedge - วิทยาศาสตร์และเทคโนโลยี


![[Full Episode] MasterChef Junior Thailand มาสเตอร์เชฟ จูเนียร์ ประเทศไทย Season 3 Episode 6](http://i.ytimg.com/vi/CVUx09Rx0-M/mqdefault.jpg)

