I believe for sure ...that one day this guy is soon going to be one of the best instructors for ML around the globe.. keep up the work buddy. you don't know that with such videos, you are helping a lot of students like me to get a clear understanding of the concept with code.
Thanks a lot for an informative view on time series data. A slight correction is that np.polyfit return first term not the constant term but it is actually the highest degree coefficient so the object is in the order deg, deg-1, … 0.
Hi Bhavesh - thank you for making this video, it's really great! Quick question - is there a reason you didn't use the original estimated trend as the trend? Rather than doing the 2nd degree polynomial twice, does it make a lot of difference? Thanks!
Trend is like a best fit line. If we choose trend in the first case, it will include seasonal data. The difference will be more if the seasonal values are drastically increasing or decreasing.
Briliant. I am new to data science and timeseries analysis in general, and i find this video very useful. My question is, how can I quantify or assess the 'strength' of my data's seasonality? more specifically, I want to write a code that automatically detects if my data is seasonal or not. an example of a dataset i want to work on is hourly temperature fluctuations (high temp during the day, low temp during the night). How can I automate a test that checks whether this data follows a seasonal trend or not? Thanks!
Why did you set frequency as 30 when the data was sampled at monthly level?, Shouldn't the frequency be 12? (As you were considering monthly seasonality)
assuming your column in dataframe df is sales s = sm.tsa.seasonal_decompose(df["sales"]) df["trend"] = s.trend df["seasonal"] = s.seasonal df["resid"] = s.resid Hope it helps :)
They both are same from my understanding. First he created the trend line directly from train data, in 2nd case he created the trend line from the de-seasoned time series. Since its an additive model it dosen't matter I suppose.
Hi Bhavesh and fellow colleagues, can I do Neural Decomposition of time series data in python? If so may you please help with some video or literature. Thank you in advance. By the way, excellent video there, keep up the good work


I believe for sure ...that one day this guy is soon going to be one of the best instructors for ML around the globe.. keep up the work buddy. you don't know that with such videos, you are helping a lot of students like me to get a clear understanding of the concept with code.
Thanks a lot for an informative view on time series data. A slight correction is that np.polyfit return first term not the constant term but it is actually the highest degree coefficient so the object is in the order deg, deg-1, … 0.
Thanks for the info!
Nice One man ! Bhavesh!
Very good explanation, nice video!
Glad it helped!
Very informative and also
thank you so much for sharing the ipynb :)
Nice video Bhavesh! What Microphone do you use to record?
I use MacBook Pro to record my videos!
thanks a lot, I was looking for such a video
Thanks for the video! Is setting period=30 in seasonal_decompose, is same as doing groupby by month in detrended ts?
Hi Bhavesh - thank you for making this video, it's really great! Quick question - is there a reason you didn't use the original estimated trend as the trend? Rather than doing the 2nd degree polynomial twice, does it make a lot of difference? Thanks!
Trend is like a best fit line. If we choose trend in the first case, it will include seasonal data. The difference will be more if the seasonal values are drastically increasing or decreasing.
@@Moiz_tennis Thank you, this makes sense!
please make a video on Multiple seasonal trend decomposition using LOESS
Once we decompose the train data how do we forecast for future?
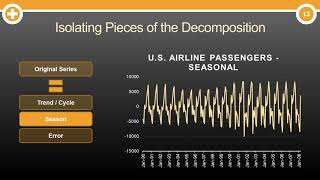
What's the y-axis in case of trend line and seasonal curve after decomposition?
Hi Bhavesh! This is awesome - what does it mean to fit a polynomial on a time series?
How can we check which model is better in time series , Additive model or multiplicative model...?
Briliant. I am new to data science and timeseries analysis in general, and i find this video very useful. My question is, how can I quantify or assess the 'strength' of my data's seasonality? more specifically, I want to write a code that automatically detects if my data is seasonal or not. an example of a dataset i want to work on is hourly temperature fluctuations (high temp during the day, low temp during the night). How can I automate a test that checks whether this data follows a seasonal trend or not? Thanks!
Your decomposition using numpy and pandas was for additive, what about multiplicative?
Thank you bro to tell every code in detail. Also I have subscribed you. Please help us by making more such informative videos.
Can you show the how did you model and model for the same data further?
Very Nice Video
I have a question what is meant by the second polynomial when just starting separating seasonality from your time-series data
Amazing stuff.
Why did you set frequency as 30 when the data was sampled at monthly level?, Shouldn't the frequency be 12? (As you were considering monthly seasonality)
My question too. I think it might have something to do with him having a datetime index in his dataframe.
After decomposing, instead of plots can I have the values for the components in a csv?
assuming your column in dataframe df is sales
s = sm.tsa.seasonal_decompose(df["sales"])
df["trend"] = s.trend
df["seasonal"] = s.seasonal
df["resid"] = s.resid
Hope it helps :)
If we have two columns with index so total columns is 3 ?
I'm trying from long time but I'm failing. Please help
for time series data, the date-time column should be the index, and make sure its not in String format but Date-Time format
Hi Bhavesh, I am a little confused
Why was there de-trending happening twice?
They both are same from my understanding. First he created the trend line directly from train data, in 2nd case he created the trend line from the de-seasoned time series. Since its an additive model it dosen't matter I suppose.
Hi Bhavesh and fellow colleagues, can I do Neural Decomposition of time series data in python? If so may you please help with some video or literature. Thank you in advance.
By the way, excellent video there, keep up the good work
Showing Name error
please improve camera quality