Thanks for the great video! How would you extend the forecast line to go beyond the actual lines? I am attempting to create this on a monthly level, so that there would be one historical/cumulative line that would illustrate a lower value for the current month as compared to the EOM value in the forecast line. Thanks!
In some paper they have asked Which is not a forecasting technique Regression Time series HOLT & WINTER method Exponential smoothing Which option I need to select ??
pretty good thanks , I do generally run same but with max , min & average forcast in your end variable + a manual factor that works as pull or push depending the situation . Thanks again
Hello, how do I verify the prices of competitors products through their websites on Power BI? For example, a supermarket site or a site that sells infoproduts?
you will need to look into page scraping technics using python or something, this is not strictly speaking something power bi can natively do. Also, be aware that your competition most likely will not like you scraping their pricing information, etc
Hello, I am struggling to plot a lower bound and upper bound using standard deviation. It would be great if you can help me in this. Thanks in advance ☺
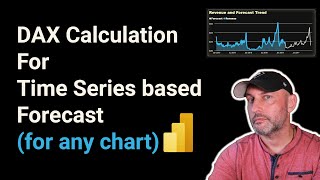
I have to say this forecast is not very good at all for generic use. I appreciate you sharing your implementation, but there is so many assumptions that make it not useful for other use cases at all In essence you are doing a time series forecast, but: - the deathgrowth assumes a YoY increase in trend, since you are using the max deaths and min deaths to calculate the trend - the measure only works for 2020 since you hardcoded the year - your concept of seasonality and trend is the same in your example thank you!


Thanks for the great video! How would you extend the forecast line to go beyond the actual lines? I am attempting to create this on a monthly level, so that there would be one historical/cumulative line that would illustrate a lower value for the current month as compared to the EOM value in the forecast line. Thanks!
In some paper they have asked
Which is not a forecasting technique
Regression
Time series
HOLT & WINTER method
Exponential smoothing
Which option I need to select ??
pretty good thanks , I do generally run same but with max , min & average forcast in your end variable + a manual factor that works as pull or push depending the situation . Thanks again
you are very welcome!
Very interesting, thank you. Amazing what can be achieved with a few lines of DAX.
You're very welcome!
Hi,in my scenario i want to calculate forecast value based on previous month value and want to display from Jan to dec .suggest me dax formula
Awesome measure. I will be utilizing this everywhere.
:)
that's a great video, thank's you for such a detailed explanation
thank you!
Thanks. That's great code. Even Alberto Ferrari would be impressed with that 👍
Hello, how do I verify the prices of competitors products through their websites on Power BI? For example, a supermarket site or a site that sells infoproduts?
you will need to look into page scraping technics using python or something, this is not strictly speaking something power bi can natively do. Also, be aware that your competition most likely will not like you scraping their pricing information, etc
@@KnowledgeBankPro Thank you :)
Do u calculate saisonality how ?
Hello, I am struggling to plot a lower bound and upper bound using standard deviation. It would be great if you can help me in this.
Thanks in advance ☺
Great content as always.
Much appreciated!
I have to say this forecast is not very good at all for generic use.
I appreciate you sharing your implementation, but there is so many assumptions that make it not useful for other use cases at all
In essence you are doing a time series forecast, but:
- the deathgrowth assumes a YoY increase in trend, since you are using the max deaths and min deaths to calculate the trend
- the measure only works for 2020 since you hardcoded the year
- your concept of seasonality and trend is the same in your example
thank you!