
- 79
- 289 073
Milos Makes Maps
Netherlands
เข้าร่วมเมื่อ 6 ส.ค. 2011
I paint the world with R and teach you how to unleash your inner map artist. Join my map adventures and tutorials now!
Create 3D Interactive Maps
In this step-by-step tutorial, we dive deep into using the Mapdeck R library to create dynamic, interactive 3D terrain maps powered by Mapbox GL JS and Deck.gl. Whether you’re a data visualization enthusiast, a GIS professional, or an R programming hobbyist, this tutorial is your ultimate guide to creating eye-catching and functional 3D maps.
🌟 What You'll Learn in This Tutorial:
1️⃣ How to prepare and format texture and elevation data for a seamless 3D terrain map.
2️⃣ How to integrate NASA FIRMS fire events into your map for a specific location and timeframe.
3️⃣ Tips for making your maps truly interactive with advanced visualization techniques.
🚀 By the end of this video, you’ll have a professional-quality, fully functional 3D map showcasing real-world fire event data-perfect for presentations, reports, or personal projects.
💡 Why Mapdeck?
Mapdeck combines the power of R, Mapbox, and Deck.gl, making it one of the most versatile libraries for interactive maps. This tutorial simplifies the process, showing you how to unlock its full potential with just a few lines of code.
🔗 Resources Mentioned in the Video:
Full code in my GitHub repo:
github.com/milos-agathon/3d-dynamic-fire-maps
Earthdata registration page: urs.earthdata.nasa.gov/
NASA FIRMS data: firms.modaps.eosdis.nasa.gov/active_fire/
Mapdeck library documentation: deck.gl/docs/api-reference/geo-layers/terrain-layer
💬 Have questions or suggestions? Drop them in the comments below! I’d love to hear how you’re using 3D terrain maps in your projects.
Follow my work on Instagram:
milos_makes_maps
Let's connect on X:
milos_agathon
Follow me on BlueSky:
bsky.app/profile/milos-makes-maps.bsky.social
If you like my work, consider buying me a coffee:
www.buymeacoffee.com/milospopovic
👍 If you find this tutorial helpful, don’t forget to like, subscribe, and share for more R tutorials and data visualization content!
มุมมอง: 445
วีดีโอ
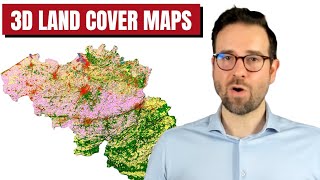

How to Make 3D Land Cover Maps in R
มุมมอง 2.1Kหลายเดือนก่อน
In this step-by-step tutorial, I’ll guide you through creating stunning 2D and 3D land cover maps using the ESA Global Land Cover Dataset, one of the most accurate datasets available today. Whether you're a GIS professional, a data enthusiast, or just getting started with mapping, this video is perfect for leveling up your cartography skills! 📌 What You'll Learn: ✅ How to access and download th...
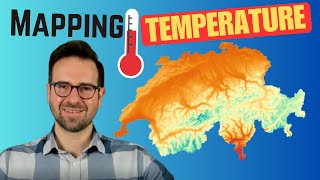
Visualize Temperature with R
มุมมอง 1.3Kหลายเดือนก่อน
Ready to bring climate data to life? In this hands-on tutorial, I’ll walk you through using the KrigR package in R to: ✅ Effortlessly download ERA5 climate data from ECMWF’s Climate Data Store (CDS). ✅ Perform kriging to interpolate spatial data for high-precision mapping. ✅ Calculate seasonal temperature averages and anomalies for meaningful insights. ✅ Create stunning static maps and dynamic ...

Create 3D Building Height Maps
มุมมอง 2.5K2 หลายเดือนก่อน
Dive into this hands-on tutorial where I explore the newly released Google Open Buildings Temporal Dataset, packed with detailed insights on building presence and height across Central & South America, Africa, and South & Southeast Asia. 🌍 In this video, you'll learn how to: ✅ Access the dataset via Google Earth Engine. ✅ Filter data by confidence interval estimates for accuracy. ✅ Combine it w...
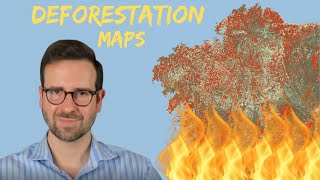
Mapping forest loss with R
มุมมอง 2.8K3 หลายเดือนก่อน
In this hands-on tutorial, you'll learn how to analyze and visualize deforestation trends with data from the Global Forest Change (GLAD) project. Perfect for GIS enthusiasts, environmentalists, and data scientists, this video guides you through every step to turn raw forest data into stunning, informative maps. 🌍 Here’s what you’ll learn: ✅ How to fetch forest cover and tree loss data for your ...

Install & Customize Positron
มุมมอง 3.1K4 หลายเดือนก่อน
In this video, I’ll walk you through Positron, the latest IDE that combines the best of R and Python in the powerful VSCode environment. Whether you’re a data scientist or developer, this tutorial will help you seamlessly set up and customize your environment to boost productivity. 🔧 What you’ll learn: ✅ How to download and install R, RTools, and Positron. ✅ Setting up Positron to integrate nat...
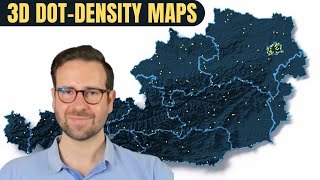
3D Dot Density Maps in R
มุมมอง 2K5 หลายเดือนก่อน
Today, we're diving into the fascinating world of dot density maps. Dot density maps are like sprinkling magic dots across a map to reveal hidden patterns. Each dot represents a specific number of occurrences of something cool-like population, housing density, or even crime rates. In today's tutorial, we'll roll up our sleeves and create 2D and 3D dot density maps using R, ggplot2, and rayshade...
![Install R and RStudio [2024]](http://i.ytimg.com/vi/HzGVz8ju3W8/mqdefault.jpg)
Install R and RStudio [2024]
มุมมอง 4.8K5 หลายเดือนก่อน
This video is your straightforward guide to installing R and RStudio on your computer. I'll show you how to set everything up, configure RStudio, and get the essential packages for GIS and data analysis. Follow these three easy steps, and you'll be ready to tackle data science projects in no time. Let's get started! Chapters 0:00 Intro 00:14 STEP 1: Download and install R 02:30 STEP 2: Download...

Creating Temperature Anomaly Maps in R
มุมมอง 1.5K6 หลายเดือนก่อน
In this tutorial, you'll learn how to use NASA's gridded surface air temperature anomaly data to create detailed monthly and yearly maps in R. We'll cover how to reproject the data into different map projections, including Robinson and Orthographic, and how to visualize it using ggplot2. This guide is perfect for anyone interested in climate data or mapping in R. Check the full code in my GitHu...
Visualize 3D Elevation and Rivers
มุมมอง 8K6 หลายเดือนก่อน
Explore the capabilities of the `rayshader` package in R with my new tutorial. I'll guide you through the process of creating detailed 3D elevation and river maps for any country. This step-by-step tutorial is perfect for anyone looking to enhance their mapping skills with powerful visualization tools. 🌍🖥️ Check the full code in my GitHub repo: github.com/milos-agathon/3d-river-maps Follow my w...
Create tree height maps
มุมมอง 2.2K7 หลายเดือนก่อน
In this tutorial, I'll guide you through the process of downloading the latest tree canopy height data from Meta and the World Resources Institute, with a detailed resolution of 1 meter. You'll learn how to create clear static maps using ggplot2 in both light and dark themes, as well as interactive maps with leaflet. This step-by-step guide is perfect for anyone interested in enhancing their ma...
Mapping Shipping Traffic with R
มุมมอง 1.2K7 หลายเดือนก่อน
In this tutorial, we'll explore how to utilize data from the World Bank and IMF on global shipping traffic, along with EOG VIIRS nightlight data. You'll learn to create clear and detailed maps for any region worldwide using ggplot2 in R. This guide is ideal for those interested in data visualization and geographic mapping. Check the full code in my GitHub repo: github.com/milos-agathon/shipping...
Mapping Land Cover
มุมมอง 9648 หลายเดือนก่อน
Welcome to today's tutorial, where we explore the varied landscapes of our planet through ESA's advanced satellite data. Using Microsoft's Planetary Computer STAC API, we'll delve into mapping Earth's land cover with the programming language R. From green forests to urban areas, join us as we reveal the details of our planet's surface. Remember to subscribe for more insights into the world of E...
Visualizing Traffic Noise
มุมมอง 8698 หลายเดือนก่อน
Today's tutorial offers a comprehensive guide on utilizing the European Environmental Agency's traffic noise data. We will demonstrate how to calculate noise levels for major roads and illustrate the process of creating informative noise maps using R. Check the full code in my GitHub repo: github.com/milos-agathon/traffic-noise-maps Follow my work on Instagram: milos_makes_maps Le...
The Ultimate Guide to R-ArcGIS Connection
มุมมอง 2.2K10 หลายเดือนก่อน
The Ultimate Guide to R-ArcGIS Connection
3D elevation and urban area maps with R
มุมมอง 4.6K10 หลายเดือนก่อน
3D elevation and urban area maps with R
How to Make a Sex Ratio Map with Meta’s Data for Good in R
มุมมอง 1.1K10 หลายเดือนก่อน
How to Make a Sex Ratio Map with Meta’s Data for Good in R
Learn to Make 3D Maps with Light Bubbles using rayshader in R
มุมมอง 1.3K10 หลายเดือนก่อน
Learn to Make 3D Maps with Light Bubbles using rayshader in R
Mapping Carbon Emissions Per Capita with R
มุมมอง 1.9K11 หลายเดือนก่อน
Mapping Carbon Emissions Per Capita with R
How to Make Amazing 3D Vintage Topo Maps
มุมมอง 3.9K11 หลายเดือนก่อน
How to Make Amazing 3D Vintage Topo Maps
it would be great without background music.
Thanks for your feedback! I removed it in more recent videos
This Master of such beutiful creations deserves a lot of coffees, please consider to donate!
Thank you, I like coffee 😁
thanks for the great tutorial Milos I'm 100% new to R While testing some 3d cover map R code, I notice my C: HD filling up with large tiff files ([subst] Estimated disk space needed without compression: 181GB. Available: 89 GB.) What would be the process to "move" all generated files to a different drive or Dropbox?
Hello Sir how can we have your book
Hey there! I haven’t published a book yet 😁 - but I’m curious, would you be more interested in a coding guide or an atlas? Let me know!
Great tutorial 💯
Thank you so much, Luis! I’m glad you enjoyed the tutorial. Let me know if you have any questions or if there’s a specific topic you’d like me to cover next!
Based 🤑
Unfortunately, rgeoboundaries was removed from CRAN at the end of November. Please run this chunk to install it from the GitHub repo instead: install.packages("remotes") remotes::install_github("wmgeolab/rgeoboundaries")
Hi guys, does anyone here had problems to install rgeoboundaries? It get the "ERROR: lazy loading failed". I tried different ways and couldn't.
Unfortunately, rgeoboundaries was removed from CRAN at the end of November. Please run this chunk to install it from the GitHub repo instead: install.packages("remotes") remotes::install_github("wmgeolab/rgeoboundaries")
Where did the option of setting working directory go?
What do you mean?
@@milos-makes-maps using RStudio i can setwd() or use the top bar to do with. The only way i can set a working directory is doing with in console on Positron.
can i do it in python?
I don't think so
Hi Milos, can you help me with this error? rgee::ee_check() Error en strsplit(a, "[.-]"): argumento de tipo no-carácter I can not pass from here and I do not find the solution. i already updated reticulate and rgee packages. Thanks for your time!
Hi, I noticed that someone has already posted this question on the rgee GitHub page. No reply from the package maintainers yet. Try installing the latest rgee version
Thank you for sharing your knowledge Milos, do you think it would be possible to do this analysis for land use and land cover data in Brazil? like TerraClass data.
Hi Juliana, to be honest, I haven't used the TerraClass data. I imagine that you would have to modify the code to fetch the data from its origin. Also, you would need to define the land cover colors and assign them to each land cover value
Absolutely loved this
Thank you for your kind comment! Glad you enjoyed my tutorial!
I am new with R, can you suggest platforms to run R? I try setup on colab notebook but it isn't work
Hi, here is a list of videos to help you set up R in a few editors Set up R in VS Code: th-cam.com/video/k79H8EeR5Jo/w-d-xo.html Install R and RStudio th-cam.com/video/HzGVz8ju3W8/w-d-xo.html Download, set up and customize Positron for R th-cam.com/video/wsRaPPqSgmc/w-d-xo.html
Wow, rgeoboundaries was removed from CRAN after I published this tutorial. You can still download it from the GitHub repo using this code: install.packages("remotes") remotes::install_github("wmgeolab/rgeoboundaries")
tried this and I'm having a hard time getting rgeoboundaries installed :( ERROR: lazy loading failed for package ‘rgeoboundaries’ * removing ‘/cloud/lib/x86_64-pc-linux-gnu-library/4.4/rgeoboundaries’ Warning message: In i.p(...) : installation of package ‘/tmp/RtmpDl66nI/file1445498896f/rgeoboundaries_1.3.1.tar.gz’ had non-zero exit status
Please share the way how to install rgeoboundaries
Wow, that's a bummer that it coincided with the release of my tutorial. You can still download it from the GitHub repo using this code: install.packages("remotes") remotes::install_github("wmgeolab/rgeoboundaries")
hello pls help! i cant get the terminal to work, when i click r terminal it gives me ...\bin .exe does not exist TT how do i make it exist (im completely new to coding and stuff)
Hi i am new to this, please i am having problems with installing "rgeoboundaries" as it's saying it's not available for the version of R (4.4.1), any help would be greatly appreciated
Wow, rgeoboundariee was removed from CRAN after I published this tutorial. You can still download it from the GitHub repo using this code: install.packages("remotes") remotes::install_github("wmgeolab/rgeoboundaries")
Great Milos
how did you add your libraries as mine is not coming up. thanks
Wow, rgeoboundariee was removed from CRAN after I published this tutorial. You can still download it from the GitHub repo using this code: install.packages("remotes") remotes::install_github("wmgeolab/rgeoboundaries")
Hay no 2024!!!
Add the coordinates
I discuss in the video how you can add them
Thank you so much for sharing this valuable knowlege with us, if I end up using this in my research paper I'll send you the map I'll come up with
Fantastic! I'm eagerly awaiting your map 😁
here in windows, I solved the issue with languageserversetup::languageserver_install() by adding WMIC. Error in languageserversetup::languageserver_install() : The command ‘wmic process where processid=16780 get commandline’ cannot run successfully. You can do to same so solve it by this guide: Open Settings: Press Windows + I to open the Settings app. Navigate to Optional Features: Go to System > Optional features. Add an Optional Feature: Click on Add an optional feature. Search for WMIC: In the search box, type WMIC and check the box next to it. Install: Click Next and then Install Once done, get back Rgui / open Rgui again and try to run it languageserversetup::languageserver_install()
Hi Milos. Thanks for your work, it's awesome. All ok until i run ee_check, then this appears: rgee::ee_check() ◉ Python version ✔ [Ok] C:/.........example............... Error en strsplit(a, "[.-]"): argumento de tipo no-carácter
I am having the same issue
Can this do a Lake basin area that covers several countries?
Yes, absolutely!
To chip in... Lake Chad in Central Africa would actually be a great choice @@milos-makes-maps
> country_land_cover <- terra::crop( + land_cover_raster, + country_sf, + snap = "in", + mask = TRUE, + overwrite=TRUE + ) Error: [crop] cannot create dataset
The terra::crop function requires a valid raster and an extent or spatial object so that's why you see this error. If the input raster is not provided crop can fail since there's no raster to crop. Please check if you downloaded the files and if you loaded them as virtual raster tiles (VRT) into R in the previous steps
Thanks! :)
Welcome!
Thank you
best tutorial on youtube!! thanks so much, had wasted time on like 3 other videos
Glad it worked for you!
Ireland be like ⬜️->⬛️
Using your code at line 82 I get error - Error: unable to find an inherited method for function ‘varnames’ for signature ‘x = "NULL"’ I cant figure out why. Thanks for the videos
That's strange! Did you follow all the steps from the video: - register with both ECMWF and CDS - download the latest KrigR package - used your credentials - downloaded the data to your local drive?
👏👏👏👏
104M RAM is a lot. What is your recommended approach to ovecome this limit?
Can you be more precise?
@milos-makes-maps I mean, it restarts my R sessions if I try over 24MB of RAM. Could it be done in some other way?
Luxembourg :🗿
Thank you for video. When i calculate covariates_ls, I get a error below "Error: ! unable to find an inherited method for function 'varnames' for signature 'x = "NULL"' Hide Traceback x 1. \-KrigR::CovariateSetup(...) 2. \-terra::varnames(Covariates) 3. \-methods (local) `<fn>`(`<list>`, `<stndrdGn>`, `<env>`) How can i solve the problem?
Hi, it looks like the error you're encountering is due to the varnames function not being able to find an appropriate method for the input Covariates, which is NULL. This often happens when the input data is not correctly specified or missing. Are you replicating my analysis or trying out something else? Where does the error occur in the code? Have you checked if you successfully downloaded the ERA% data in the previous step?
Same problem for me
@@milos-makes-maps I have the same error. I am using your code from the Github. Error occurs after line 82
Is there any way of obtaining a free API key for the ggmap r package?
From ggmap readme page (the first search result on Google): "Stadia Maps offers map tiles in several styles, including updated tiles from Stamen Design. An API key is required, but no credit card is necessary to sign up and there is a free tier for non-commercial use. Once you have your API key, invoke the registration function: register_stadiamaps("YOUR-API-KEY", write = FALSE). Note that setting write = TRUE will update your ~/.Renviron file by replacing/adding the relevant line. If you use the former, know that you’ll need to re-do it every time you reset R." cran.r-project.org/web/packages/ggmap/readme/README.html
Great job!! And useful! About the data source, I am working on municipalities of Catalonia (Spain) and, by empirical observation, I have the impression that forest data coming from Landsat are more accurate than those from Sentinel 2 (you made a tutorial on it one year ago)... May be?
great video! as a agriculture background I want to see you creating some remote sensed based map which related to agriculture. There is lot of data on CDS. But sometime the data bot fetched. Hope you can provide a solution and a great video on like vegetation index, leaf area index and more.
Thanks! I'll keep that topic in mind. The agricultural data is a topic worth considering for my tutorials
Great stuff as usual! Can you suggest which resources are being most used by R and rayshader? I checked, and they don’t have GPU support, so should I get more RAM or CPU power for faster output? As always, I love watching your videos. You’re making things accessible to people, and the impact you’re having is amazing. I always appreciate people who make things easier for others.
Thank you so much for your kind words! I'm glad to hear that you find the videos helpful. Regarding your question about resources for R and rayshader, it's true that they currently don't have GPU support. Generally, more RAM can help with handling larger datasets, while a faster CPU can speed up computations. However, the best option can vary depending on your specific needs. For more detailed guidance, I recommend posting this excellent question in the rayshader GitHub repository (github.com/tylermorganwall/rayshader). The community there is incredibly knowledgeable and supportive, and they can provide insights tailored to your situation.
Awesome video! thanks a lot for it. As a suggestion for a new video/project: I'd be super interested in calculating the urban heat island effect from remote sensing data :)
Sounds like a great idea! I'll add it to my to-do list 😉
Great one!
Thank u for this insightful tutorial! Im having an issue with rayrender when adding roads to the 3d map, it says that the attribute "render_path" doesn't exist, do u have any idea how to solve this or if there s any alternative to use ?
Hi, thanks for the video. i'm new to mapping using R thanks to you, i tried replicating with your processes but i am stuck somewhere. here is my code # libraries we need libs <- c( "tidyverse", "stringr", "httr", "sf", "giscoR", "scales", "ggrepel", "rnaturalearth", "rnaturalearthdata" ) # install missing libraries installed_libs <- libs %in% rownames(installed.packages()) if (any(installed_libs == F)) { install.packages(libs[!installed_libs]) } # load libraries invisible(lapply(libs, library, character.only = T)) ### 1) DATA WRANGLING ### ----------------- file_name <- "geonames-population-1000.csv" ### get Geonames table on places with population >= 1000 get_geonames_data <- function() { table_link <- "public.opendatasoft.com/api/explore/v2.1/catalog/datasets/geonames-all-cities-with-a-population-1000/exports/csv?lang=en&timezone=Africa%2FLagos&use_labels=true&delimiter=%3B" res <- httr::GET( table_link, write_disk(file_name), progress() ) } get_geonames_data() ### load the table load_geonames_data <- function() { places_df <- read.csv(file_name, sep = ";") return(places_df) } places_df <- load_geonames_data() # Inspect data head(places_df) names(places_df) places_modified_df <- places_df[, c(2, 7, 14, 20)] # select town name, country code, population and coordinates names(places_modified_df) <- c("name", "country_code", "pop", "coords") # rename columns places_modified_df[c("lat", "long")] <- stringr::str_split_fixed( places_modified_df$coords, ",", 2 ) places_clean_df <- places_modified_df |> dplyr::select(-coords) # define longlat projection crsLONGLAT <- "+proj=longlat +datum=WGS84 +no_defs +ellps=WGS84 +towgs84=0,0,0" # transform data frame into sf object places_sf <- places_clean_df |> sf::st_as_sf( coords = c("long", "lat"), crs = crsLONGLAT ) ### 2) GET NIGERIA SHAPEFILE ### ----------------------- # Try primary method using giscoR tryCatch({ ng <- giscoR::gisco_get_countries( resolution = "1", country = "NGA" ) |> sf::st_transform(crsLONGLAT) print("Successfully retrieved Nigeria shapefile using giscoR") }, error = function(e) { # Fallback to rnaturalearth if giscoR fails print(paste("giscoR error:", e$message)) print("Trying alternate method with rnaturalearth...") ng <- ne_countries(scale = "medium", country = "Nigeria", returnclass = "sf") |> sf::st_transform(crsLONGLAT) }) ### 3) POINTS WITHIN POLYGON ### ----------------------- # points within polygon with sf ng_places <- sf::st_intersection(places_sf, ng) ### 4) PREPARE LABELED PLACES ### ------------------------ ng_labeled_places <- ng_places |> dplyr::mutate( long = unlist(map(geometry, 1)), lat = unlist(map(geometry, 2)) ) |> dplyr::select( name, long, lat, pop ) |> sf::st_drop_geometry() |> as.data.frame() |> dplyr::arrange(desc(pop)) ### 5) CREATE FINAL MAP ### ------------------ final_map <- ggplot() + # Add country boundary geom_sf( data = ng, color = "grey20", fill = "transparent" ) + # Add population points geom_sf( data = ng_places, aes(size = pop), color = "#7d1d53", fill = "#7d1d53", alpha = .5 ) + # Scale point sizes scale_size( range = c(1, 15), breaks = scales::pretty_breaks(n = 6) ) + # Add labels for top 10 cities ggrepel::geom_text_repel( data = ng_labeled_places[1:10, ], mapping = aes(x = long, y = lat, label = name), colour = "grey20", fontface = "bold", size = 4 ) + # Theme customization theme_minimal() + theme( axis.line = element_blank(), axis.text.x = element_blank(), axis.text.y = element_blank(), axis.ticks = element_blank(), axis.title.x = element_blank(), axis.title.y = element_blank(), panel.grid.major = element_blank(), panel.grid.minor = element_blank(), plot.margin = unit( c(t = 0, r = 0, b = 0, l = 0), "lines" ), plot.background = element_rect(fill = "white", color = NA), panel.background = element_rect(fill = "white", color = NA), legend.background = element_rect(fill = "white", color = NA), panel.border = element_blank() ) # Display the final map print(final_map) # Optionally save the map ggsave("nigeria_population_map.png", final_map, width = 12, height = 10, dpi = 300)
Can it be done for small area
Yes, of course, this tutorial is for small areas
@@milos-makes-maps I will be glad if you provide me with assistance when I got stuck
great videos as always Milos, anyway I have a question, what if I had a very big area of scope (e.g.: Indonesia) with multiple tiles, is there a way to save/render/process such a big map? I always encounter the memory allocation problem :(
Thanks! I have a short blob that could help you get started. Check it out here: github.com/milos-agathon/deforestation-maps/blob/main/R/multiple-files
Thanks a lot for this tutorial Milos, very helpful! I have just a small question about an information I may have missed: how can I remove the shadow in the final image?