
- 23
- 203 281
MEETMAVERICK
India
เข้าร่วมเมื่อ 22 ก.พ. 2020
This Channel is all about science & Technology. We will introduce you about new technology in the field of Astronomy, Automotive, General manufacturing, daily use physics etc.
HOW TO SELECT CONTROL CHART FOR ANY DATA / VARIABLE CHART / ATTRIBUTE CHART / USE OF CONTROL CHART
control chart can be used to monitor or evaluate a process. There are basically 2 type of control chart, those for variable data and those for attribute data. When introducing the control chart into an organization, it is important to prioritize problem area and use charts where they are most needed.
Control charts are used to routinely monitor quality. Depending on the number of process characteristics to be monitored.
#spc #controlCHART #QualityControl
Control charts are used to routinely monitor quality. Depending on the number of process characteristics to be monitored.
#spc #controlCHART #QualityControl
มุมมอง: 5 766
วีดีโอ


p chart vs np chart vs c chart vs u chart / 8 Differences between attribute control chart
มุมมอง 33K3 ปีที่แล้ว
Attribute charts are part of probability based charts. These charts uses attribute data line YES-NO, PASS-FAIL, OK-NG etc. These control charts uses categorical data and the probabilities related to the categories to identify the presence of special cause. The analysis of oratorical data by these charts general utilize the binomial or Poisson distribution. There are four types of attribute char...

u Chart formula / How to make u chart in excel / Use of u chart
มุมมอง 6K3 ปีที่แล้ว
What is u Chart? A u-chart is an attributes control chart used with data collected in subgroups of varying sizes. U-charts show how the process, measured by the number of nonconformities per item or group of items, changes over the time. Nonconformities are defects or occurrences found in the sampled subgroup. In statistical quality control, the u-chart is a type of control chart used to monito...

np Chart formula / Make np chart in excel / use of np chart
มุมมอง 3.2K3 ปีที่แล้ว
An np-chart is an attributes control chart used with data collected in subgroups that are the same size. Np-charts show how the process, measured by the number of nonconforming items it produces, changes over time. Typically, an initial series of samples is used to estimate the average number of nonconforming units per sample. The estimated average is then used to produce control limits for the...

C Chart Formula / C Chart Calculator / C Chart Used For / How to Make C Chart In Excel / Count type
มุมมอง 4523 ปีที่แล้ว
Hello Guy's, Today we will learn to make c chart in Microsoft excel. What is C Chart? In statistical quality control, the c-chart is a type of control chart used to monitor "count"-type data, typically total number of nonconformists per unit. It is also occasionally used to monitor the total number of events occurring in a given unit of time. Like other process charts, the C chart is used to de...
P Chart formula / How to make p chart in excel / how p chart is used for/ control limits
มุมมอง 7K3 ปีที่แล้ว
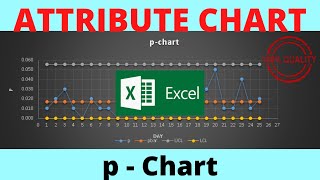
In statistical quality control, the p-chart is a type of control chart used to control the proportion of defective items in a sample, where the sample proportion nonconforming is defined as the ratio of the number of nonconforming units to the sample size, n The p-chart only accommodates "pass"/"fail"-type inspection or attribute data as determined by one or more go-no go gauges or tests, effec...

MAKE GAUGE R&R IN EXCEL / REPEATABILITY & REPRODUCIBLE FORMULA & STUDY
มุมมอง 27K3 ปีที่แล้ว
Measurement Systems Analysis (MSA) connects to measurement data that is used in nearly every manufacturing process. As the quality of the data improves, the quality of decisions improves. This guide will help you assess the quality of your measurement systems, providing a basis for recognizing where improvements can be made. The result is knowledge that can be used to improve your measurement p...

Weight Calculation Formula of Sheet, Rod, T-Bar, Prism, Pipe, Hexagonal Bar
มุมมอง 12K3 ปีที่แล้ว
Hello Guys, Today we will learn about how to calculate the weight of various shapes. Please watch video till end so that I will give you link of Weight calculator in excel. So without wasting the time lets get started. Do you wonder how Space agencies or Astro physist find the weight of planets & interstellar objects without weighing machine. if you don't then lets go to basic first. Measuremen...

5 Core Quality Tools / IATF 16949 / APQP / PPAP / SPC / MSA / FMEA
มุมมอง 26K4 ปีที่แล้ว
The Automotive Quality Core Tools are the building blocks of an effective quality management system. They include Advanced Product Quality Planning & Control Plan (APQP), Production Part Approval Process (PPAP), Failure Mode and Effects Analysis (FMEA), Statistical Process Control (SPC) and Measurement System Analysis (MSA). Over 30 years ago, AIAG collaborated with the domestic automotive manu...
7 QC Tools name & Training / Problem Solving Tools
มุมมอง 1.2K4 ปีที่แล้ว
Hello guy's, Today in the world of cutting edge technology Quality is very important but to maintain the quality some times problem arises. So today I will explain you about the 7 QC tools. Subscribe Here:- th-cam.com/channels/Hm4FwBap_zYK0XA4e02XXw.htmlfeatured?sub_confirmation=1 The 7 QC tools are also known as "The Old Seven QC Tool." "The First Seven QC Tool." "The Basic Seven QC Tool." 7 Q...
PPAP Documents / All About PPAP / PPAP 2020 / AIAG 4th Edition
มุมมอง 2.6K4 ปีที่แล้ว
Subscribe Here:- th-cam.com/channels/Hm4FwBap_zYK0XA4e02XXw.htmlfeatured?sub_confirmation=1 PPAP is valuable tool to establish a confidence between part supplier & Customer. In today's competitive environment & cutting edge technology high quality products are very important. With the ease of transportation several manufactures are importing & exporting the parts from different countries. So It...
Fishbone diagram is also known as Herringbone diagram / Cause and effect diagram / Fishikawa diagram
มุมมอง 1.1K4 ปีที่แล้ว
Hello Guys….. Today we will learn about Cause and effect diagram. Please watch full video to understand & make your concept clear. If you will like my video then please Like Share & Subscribe, so that I can make more videos on educational topic for you. So without wasting the time LETS GET STARTED.... SUBSCRIBE HERE:- th-cam.com/channels/Hm4FwBap_zYK0XA4e02XXw.htmlfeatured?sub_confirmation=1 Op...
Tool Design / Shearing Tool / Basic Calculation / Press Tool
มุมมอง 11K4 ปีที่แล้ว
Hello Guy's... Today I going to explain about basic shearing tool design calculation. There are several software & tools are available in market to design the tools but if you know there calculations then you can make your own calculator for tool design. First of all we need to know the load required for cutting. In normal terms it is called shearing force or required tonnage. Shearing force is...
Cutting process Types / Stamping Operation / Sheet Metal
มุมมอง 27K4 ปีที่แล้ว
Hello friends, Most of the people dont know cutting process more than 12 because of very small difference. Today I am going to show you 19 different cutting operation in stamping. There are more that 19 operation in actual but there is hair line difference with other operation. In this video I will try to animate the process & will try to explain use of it. So without wasting the time lets star...
Pareto Chart Analysis In Excel / problem prioritization / Problem Analysis
มุมมอง 1.2K4 ปีที่แล้ว
A Pareto or sorted histogram chart contains both columns sorted in descending order and a line representing the cumulative total percentage. Pareto charts highlight the biggest factors in a data set, and are considered one of the seven basic tools of quality control as it's easy to see the most common problems or issues. :- MS Office SUBSCRIBE THE CHANNEL bit.ly/2z38thG AIAG SPC Manual amzn.to/...
Make Histogram / Bell curve / Normal distribution chart in excel
มุมมอง 31K4 ปีที่แล้ว
Make Histogram / Bell curve / Normal distribution chart in excel
Make CP - CPK (Process Capability) Calculator in Excel with control chart
มุมมอง 8K4 ปีที่แล้ว
Make CP - CPK (Process Capability) Calculator in Excel with control chart
Corona Top Affecting Countries / Increasing Cases COVID19 / Corona Contagious
มุมมอง 1494 ปีที่แล้ว
Corona Top Affecting Countries / Increasing Cases COVID19 / Corona Contagious
Cumulative corona cases / top 10 country affected
มุมมอง 754 ปีที่แล้ว
Cumulative corona cases / top 10 country affected
Essential Budget Office Gadgets / Table Gadgets / Gadgets For Productivity Increase In Work
มุมมอง 1144 ปีที่แล้ว
Essential Budget Office Gadgets / Table Gadgets / Gadgets For Productivity Increase In Work
When & how to Use Mask WHO / Guidelines by WHO
มุมมอง 804 ปีที่แล้ว
When & how to Use Mask WHO / Guidelines by WHO
Coronavirus disease COVID 19 advice for the public / What say WHO?
มุมมอง 1374 ปีที่แล้ว
Coronavirus disease COVID 19 advice for the public / What say WHO?
Corona virus Myths / COVID19 / Facts / WHO advise / Conspiracies
มุมมอง 1694 ปีที่แล้ว
Corona virus Myths / COVID19 / Facts / WHO advise / Conspiracies
Hello
Dear Sir, Good Morning! Hope you are doing well! Could you pls share with me the 5 Core Quality tools PPT. It will be very helpful for me. Thanks a lot!
Thank you for this great course, I have a cohort for two years, just wondering can i creat p chart for one binary variable , in this case i have just 8 data point or 8 qourter
donde puedo descargar el documento?
Sir very thanks
Gage Repeatability and Reproducibility (GR&R) | Avoiding Mistakes in GR&R Analysis | GR&R Techniques th-cam.com/video/mbZSG0ccfsM/w-d-xo.html
Tq for the simple explanation video 😊
Where did u get the data of Constant? As u said Copy Paste the constant.tnx
As per sample excersie die holder thickness answer will not come
Die plate thickness = 3√fsh+10 or 3√fshx10
Super 🎉
Nice information
Sensational, thanks for sharing!
Thank you
If You r going to teach only yourself than why do you make video.
all right. please, explain this to me like I am 6 years old how you do this from 11.11 to 11.22 minutes I can't. it's imposible
Useless.. Don't waste your time on this videos...for beginners its to fast to understand...just trying to make short vdo... Useless
No need of music at all
I couldn’t hear the presentation well. An actual explanation would be good to further break it down. Liking for the algorithm👍🏿Have a good day.
Usefull info. Which is the other name of Bottom bolster plate ??
Bournti tell avi po?
Perfect , Extraordinary , most recommended thank u so much for savingthe time asir and d clarity
Can you turn the music volume up? I could still hear someone talking there
Weight of rectangular tubular calculation error. Illustration showing 100 X 200 X 10 = 43.960. You calculated 100 x 100 x 10
If explained...It's very understand. Otherwise not understand
+1
Please also give the calculation of thrust plate
MEETMAVERICK, you really need to drop the background music. I could barely hear you above it. I also think the video could have been broken into four seperate videos to make it more digestible.
Hello, can I have it in mail? thank you.
I don't understand sir
why you multiple by 10 to Thinkness of die palte?
Hi sir. Where I can refer the constant sheet that you use. Thank You.
I'd also appreciate if you could answer shamilshahudin's questions. Without an explanation where the constant sheet comes from to me the tutorial becomes useless. Thank you very much in advance.
Kal hi statistical ka exam hua bhai. 1 din phele ye video dkeh leta tho full marks aate 😭
Your video is very helpfull sir
This is great work! Thank you for sharing!
Excellent
Can you please give the source as well?
Sir please share excel workbook. I am able to understand required normal distribution and process distribution but for R&R i need some study material. I would like to know that i have two different gauge, now both gauge give different reading. the difference is in micron then how to justify that which gauge is correct. or the deviation is an gauge standard error so that one can prove that the manufactured lot is ok.
How did you find your different k values
Sir thank u
cannot hear you man
Explained very well. Thanks
This passes more for a music video than a tutorial
Thank you so much! This is so much easier to understand
hi you there bro ?
super!
Thanks!
Thanks 👍
Thank you too
Sir, I searched lots of vedio for this ... But this best combined vedio to teach and clear every doubt
Glad to hear that
Please remove the background music
Thank you. Vey easy to follow.
You are welcome!
Excellent!
Glad you liked it!